![]()
Serverless as an architectural pattern is now widely adopted, and has quite rightly challenged traditional approaches when it comes to design. Serverless enhances productivity through faster deployments bringing applications to life in minimal time. Time not spent provisioning and maintaining production infrastructure can be invested elsewhere to drive business value – because at the end of the day that’s what matters!
Now, with your Serverless application shipped into production, maintaining optimal performance requires you to focus in on the operational question of “what’s going on in production?”. In other words, you’ll need to address observability for every operation that takes place within your Serverless application.
Observability
Observability, bounds together many aspects – monitoring, logging, tracing, and alerts. Each observation pillar provides critical insight into how your deployed Serverless application is working and collectively whether your Serverless application is not just working but deriving real business value.
In this post, we are going to discuss each observation pillar, providing you with examples and solutions, which specifically address the Serverless ecosystem.
Monitoring
Monitoring is the main pillar which tells us, “is my system working properly?”. “Properly” can be defined by multiple parameters:
- Errors: every request or event that yielded an error result
- Latency: the amount of time it takes for a request to be processed
- Traffic: the total number of requests that the resource is handling
Compounded together, monitoring allows us to detect highly errored services, performance degradation across our resources, and even scaling issues when we hit higher traffic rates.
Much of our serverless deployment is undertaken within a Function as a Service (FaaS). FaaS provides us with our base compute unit, the Function. Popular examples of cloud-hosted managed FaaS services are:
Using AWS Lambda as our FaaS of choice, monitoring of Lambda functions is accomplished by using CloudWatch Metrics. With CloudWatch Metrics, every deployed function is monitored using several insightful metrics:
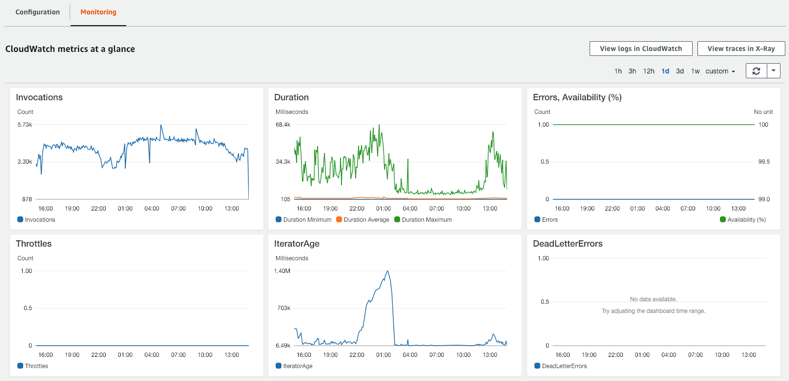
These metrics include:
- The number of invocations.
- Min/avg/max duration of invocations.
- Error counts, and availability (derived from errors/invocations ratio).
- The number of throttled requests.
- Iterator Age – The “age” of the oldest processed record.
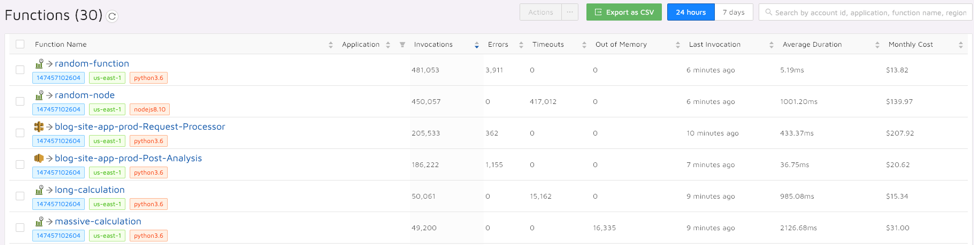
For serverless, we are still missing some unique issues such as timeouts, out of memory and even cost, which we can monitor using a dedicated serverless monitoring and troubleshooting tool, Epsagon:
Logging
When a problem has been found according to our monitoring parameters, we then need to troubleshoot it. We accomplish this by consulting and analyzing all relevant logs.
Logs can be generated by prints, custom logging, and/or exceptions. They often include very verbose information – that’s why they are a necessity for debugging a problem.
When approaching our logs, we need to know what we are looking for, so searching and filtering within and across logs is essential. In AWS Lambda, all of our logs are shipped to AWS CloudWatch Logs. Each function is assigned to its own log group and one log stream for each container instance.
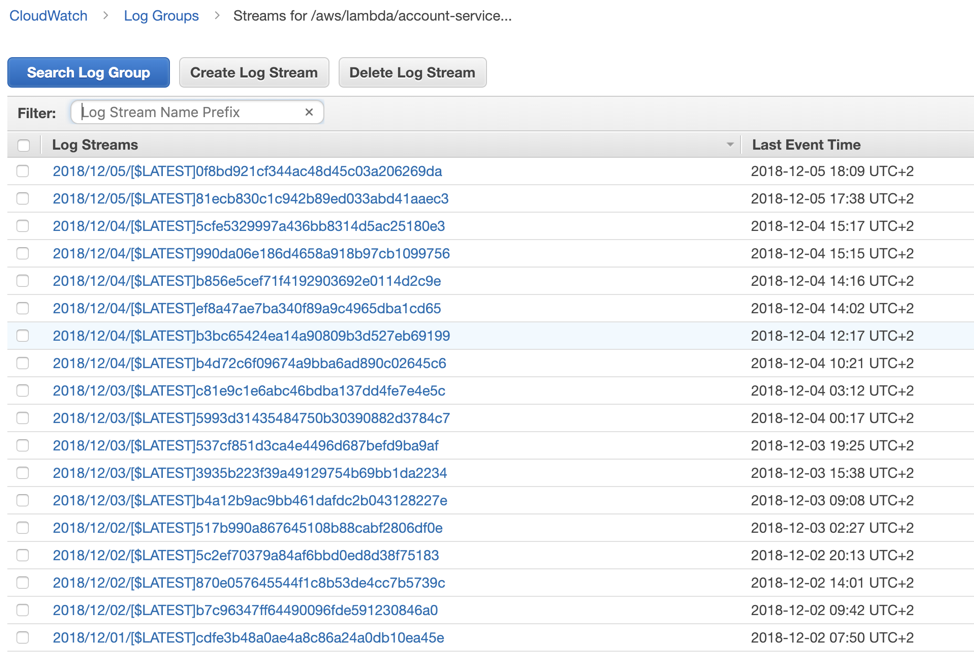
Once we find the correct log file, we can see the error message and gain a better understanding of what initiated the error.
There are better ways to look for logs other than just using CloudWatch Logs. A known pattern is to stream log data to a dedicated logs aggregation service, for example, ELK. With this in place, when a function fails you, you can simply query and find the corresponding log for the specific function invocation.
The main problem that is often associated and attributed to logs, is that they have minimal or no context. When our applications become distributed, trying to correlate between logs from different services can be a nightmare. For that particular issue, distributed tracing comes to help.
Tracing
Tracing, or specifically distributed tracing, helps us to correlate between events captured across logs on different services and resources. When being applied correctly we can utilize it to find the root cause of our errors with minimal effort.
Let’s imagine for example that we’ve built a blog site – that has the following public end-points
- View an existing post /post
- Post a new blog post /new_post
And it consists of these resources and services:
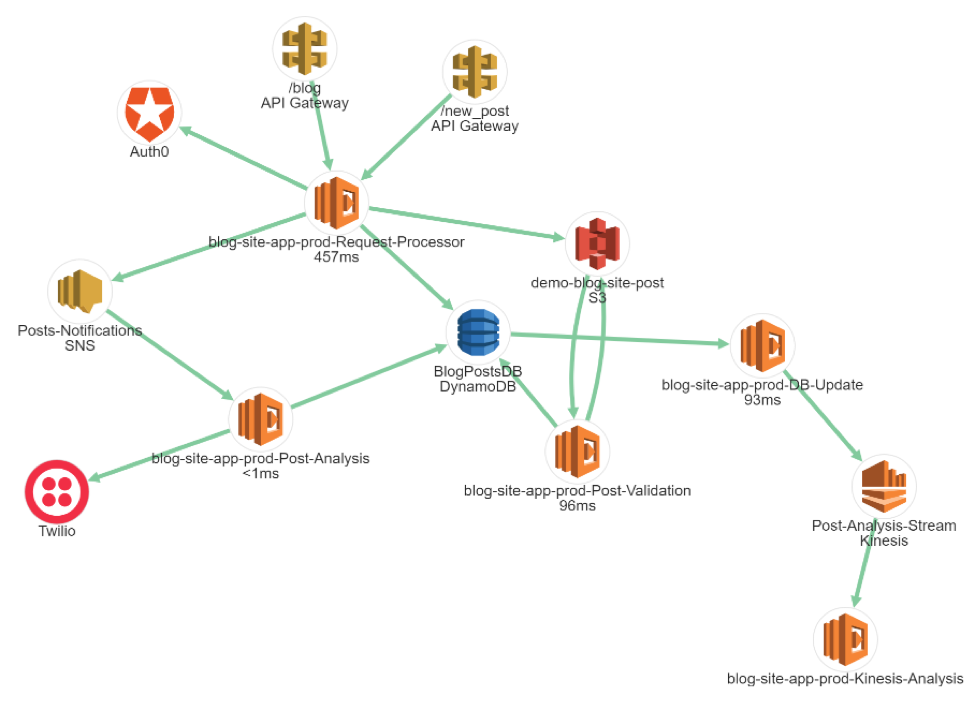
Now, by using the monitoring and logs methods from before we’ve noticed that there’s an error in our Post Analysis lambda. How do we progress from here and find the root cause of this issue?
Well, in micro-services and serverless applications specifically, we want to be able to collect each trace from our micro-services and gather them together as a whole execution.
In order for us to analyze distributed traces, we need two main things:
- A distributed tracing instrumentation library
- A distributed tracing engine
When instrumenting our code, the most common approach is to use and implement OpenTracing. OpenTracing is a specification that defines the traces’ structure across different programming languages for distributed tracing. Traces in OpenTracing are defined implicitly by their spans – an individual unit of work done in a distributed system. Here’s an example of constructing a trace with open-tracing:
span = tracer.start_span(operation_name='our operation')
scope = tracer.scope_manager.activate(span, True)
try:
    # Do things that may trigger a KeyError.
except KeyError as e:
    scope.set_tag('keyerror', f'{e}')
finally:
    scope.finish()
It’s advised to use a common standard across all your services and have a vendor-neutral API. This means you don’t need to make large code changes if you’re switching between different trace engines. There are some downsides in using this approach, for example developers need to maintain span and trace-related declarations across their codebase.
So once instrumented, we can publish and capture those traces into a distributed traces engine. Some of which will result in us being able to visually see an end-to-end transaction within our system. A transaction is basically a story of how data has been transmitted from one end to the other within the system
With an engine such as Jaeger we can view the traces organized in a timeline manner:
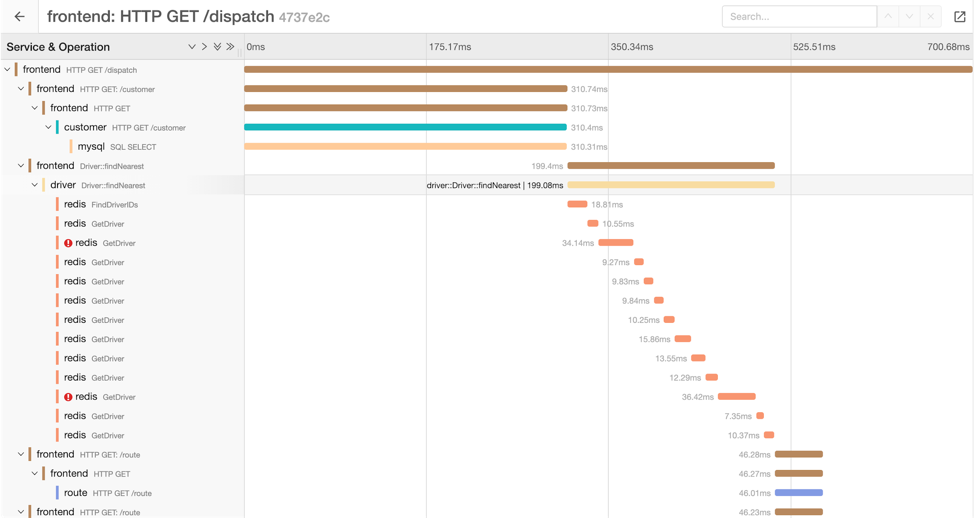
This way we can try and find the exact time this error happened and therefore find the originating event that caused the error.
By utilizing Epsagon, a purpose-built distributed tracing application which we earlier introduced, we can see that the errored lambda in question has received its input from a malformed lambda (Request Processor) two hops earlier, and that it handled an authentication error and propagated a false input to the Post Analysis lambda via the SNS message broker.
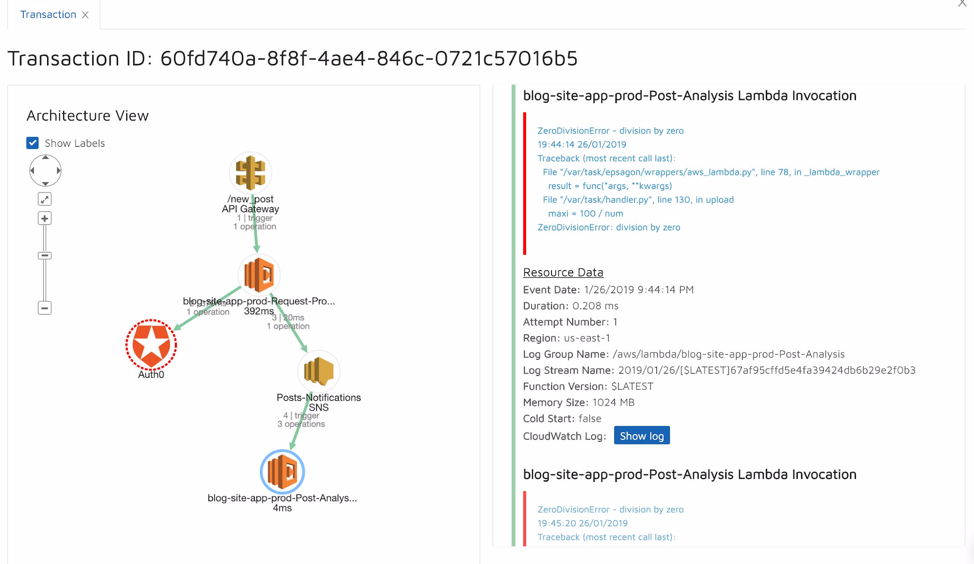
It’s important to remember that when going serverless we have broken each of our microservices into nano-services. Each of them will have an impact on the other, and attempting to figure out the root cause can be very frustrating.
Epsagon tackles this issue by visualizing the participated elements in the system in a graph, and by presenting trace data directly within each of the nodes, helps to reduce the time involved in investigating the root cause significantly.
Alerts
Last but not least, come the alerts. It’s pretty obvious to everyone that we don’t want to wait in front of a monitor 24/7 to see problems.

Being able to get alerts to an incident management platform is important, so relevant people will be able to get notified and take action. Popular alerting platforms are PagerDuty, OpsGenie, and even Slack!
When choosing your observability platform, you’ll need to make sure you can configure your alerts based on the type of issue, the involved resource, and the destination (i.e. integrates to the platforms above). For Lambda functions, basic alerts can be configured in CloudWatch Alarms:
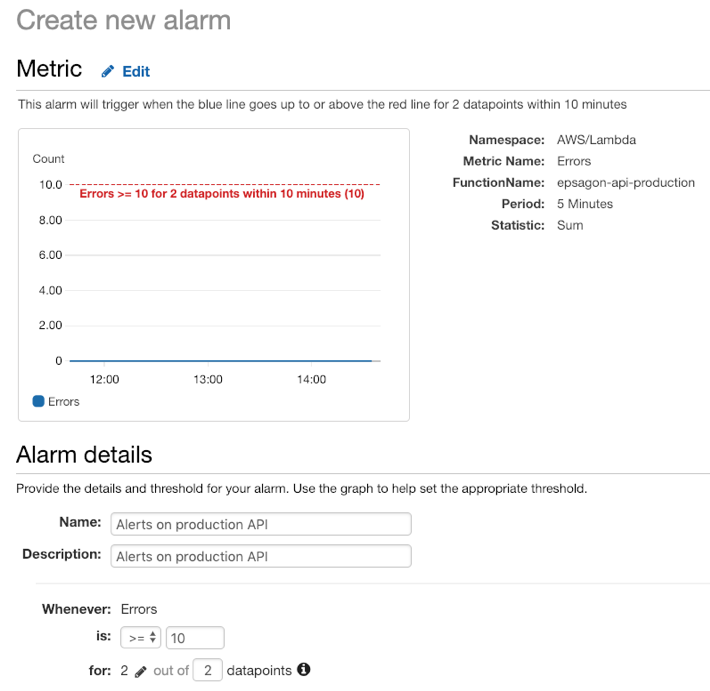
In this example, we want to get notified when we breach the threshold of 10 or more errors within 2 consecutive 5-minute windows. A dedicated monitoring tool has the capability to configure more specific alerts such as:
- Alert if the function is timing out (rather than a general error).
- Alert on specific business flows KPIs.
- Alert regarding the performance degradation of a resource (for example Redis).
Summary
We understand that observability is a broad term, that unifies many important aspects of monitoring and troubleshooting applications (in production, or not).
When going serverless, observability becomes a bottleneck for the development velocity, and a proper tool which is dedicated to the distributed and event-driven nature must be in place.
Epsagon provides an automated approach for monitoring and troubleshooting distributed applications such as serverless and reduces the friction of developers’ from losing the observability to their production.
If you’re curious and would like to learn more about serverless applications, join our webinar on the Best Practices to Monitor and Troubleshoot Serverless Applications next March 7th at 10 am PT.
