![]()
Learn how to send logs from EC2 Windows Instances, CloudTrail and Lambda Functions to AWS CloudWatch.<
This is the second part of our ongoing series on AWS CloudWatch Logs and the best ways of using it as a log management solution. In our previous post we saw how EC2 Linux instances can stream their log data to AWS CloudWatch. Here, I will show you how Windows can do it. Then I’ll talk about two other important and useful AWS services (Sending Logs from CloudTrail & Sending Logs from Lambda Functions).
Sending Logs from EC2 Windows Instances
Windows EC2 instances don’t require us to install any agent. Windows EC2 instances created with AWS-provided AMIs already have a service called EC2Config installed and running. EC2Config service version 2.2.10 or later can send the following types of information to CloudWatch:
- Windows Performance Counters metrics
- Application, System, Security and IIS Logs from Windows Events
- Any logs generated from applications like Microsoft SQL Server
In our test case in the last post, we created a Windows Server 2012 EC2 instance from an AWS AMI which comes with SQL Server 2014 Standard Edition pre-installed. And once again, we launched the instance with the EC2-CloudWatch_Logs IAM role. For those who did not follow the first part of this series, check the link above to the properties for this role.
Let’s now have a quick introduction to SQL Server error logs. SQL Server saves its log events in a file called ERRORLOG. With the Windows AMI we have chosen, this file resides in the following directory:
C:\Program Files\Microsoft SQL Server\MSSQL12.MSSQLSERVER\MSSQL\LogBy default, the error log is periodically recycled by the server. When that happens, a new ERRORLOG file is generated and the older file is renamed with a numbered suffix (1). The other older files are also renamed with their numbered suffix shifting by one. This number can go up to 6. So ERRORLOG will be the current log file, ERRORLOG.1 will be the log file that has just been recycled, ERRORLOG.2 will be the file before that and so on.
The log records are also saved in Windows Application Event Log. From there, any warnings, information, or errors can be filtered on the event source type (MSSQLSERVER). Here is an example of SQL Server log data seen from the SQL Server Management Studio:

We want this data to be available in the AWS CloudWatch Logs. To make this happen, follow these 4 steps:
Step1. First, open the EC2Config Service properties window. To get there, you just search for “EC2Config” in Windows search. As you can see from the image below, it’s just a dialog box with some options. The important part is the checkbox showing “Enable CloudWatch Logs integration”. Make sure this is ticked and then, click Apply, and OK.

Step 2. Next, you need to create a JSON file with configuration details for CloudWatch. The name of this file is AWS.EC2.Windows.CloudWatch.json. There’s already a file with this name available in this directory:
C:\Program Files\Amazon\Ec2ConfigService\SettingsRename the file and create a new copy from it. Name the new one AWS.EC2.Windows.CloudWatch.json.
Change the new file’s content as shown below:
{
    "EngineConfiguration": {
        "PollInterval": "00:00:15",
        "Components": [
            {
                "Id": "CustomLogs",
                "FullName": "AWS.EC2.Windows.CloudWatch.CustomLog.CustomLogInputComponent,AWS.EC2.Windows.CloudWatch",
                "Parameters": {
                   "LogDirectoryPath": "C:\\Program Files\\Microsoft SQL Server\\MSSQL12.MSSQLSERVER\\MSSQL\\Log",
                    "TimestampFormat": "yyyy-MM-dd HH:mm:ss.ff",
                    "Encoding": "UTF-16",
                    "Filter": "ERRORLOG",
                    "CultureName": "en-US",
                }
            },
            {
                "Id": "CloudWatchLogs",
                "FullName": "AWS.EC2.Windows.CloudWatch.CloudWatchLogsOutput,AWS.EC2.Windows.CloudWatch",
                "Parameters": {
                    "AccessKey": "",
                    "SecretKey": "",
                    "Region": "ap-southeast-2",
                    "LogGroup": "Database_Logs",
                    "LogStream": "SQL_Server_Logs"
                }
            }
        ],
        "Flows": {
            "Flows":
            [
                "CustomLogs,CloudWatchLogs"
            ]
        }
    }
}
So what are we doing here? Here’s what’s happening:
- We are configuring EC2Config to poll whatever log source we are defining every fifteen seconds.
- Next, we are defining “components” for our logging operation. The first section has an ID of “CustomLogs”. We are defining some parameters for this component that actually represent the SQL Server error log file. These parameters include items like the path to the log file, it’s encoding, date time format, and the actual file name.
- The second component, “CloudWatchLogs” defines which region we want the logs to be sent to, and the log group and log stream names. Note how we have left the AWS credential fields blank. That’s because we have assigned an IAM role to the machine when it was launched.
- Finally, we are mapping the CustomLogs component to the “CloudWatchLogs” component in the “Flows” section. In other words, we are telling EC2Config what to do with those log files. When EC2Config service sees the “Flows” section, it looks at the mapping of the component identifiers (in this case “CustomLogs” to “CloudWatchLogs”) and knows where to send the data.
The AWS.EC2.Windows.CloudWatch.json file shown here is fairly simple because you are using it to send only one application log to CloudWatch. This would have multiple sections if items like Event Log, IIS logs, other application logs or Windows Performance Counters were to be sent to CloudWatch.
Step 3. After saving the file, we restart the EC2Config service from the Windows Services applet.

Step 4. Finally, restart the MSSQLSERVER service from the SQL Server Configuration Manager. AWS documentation says we don’t have to do this, but our tests showed EC2 sends SQL logs to CloudWatch when you restart. This can be an issue for busy production SQL Servers, so keep that in mind.

Once the services restart, SQL logs will be available from AWS CloudWatch:

To test the flow of log events, create an empty database in SQL Server like we have. Ours is named mytestdb.
As you can see, the SQL Server error log captures the event, and from there it flows onto CloudWatch:

Sending Logs from CloudTrail
Beside EC2, AWS CloudWatch can also host logs sent by the AWS CloudTrail service. AWS CloudTrail is another web-service that captures every API call made against AWS resources in your account.
Calls are made to AWS API endpoints whenever AWS resources in your account are accessed, created, modified or deleted from the GUI console, CLI commands or third-party programming languages calling the AWS SDK. When this happens, CloudTrail records each of these interactions and records every API call made. It then delivers the captured logs to an S3 bucket in your account.
With a simple tweak, CloudTrail logs can also be redirected to CloudWatch. The process requires CloudTrail to assume an IAM role with sufficient privileges to send the log data to CloudWatch. You can custom create such a role or use the one that comes by default.
In the image below, we are configuring AWS CloudTrail service:

As you can see, CloudTrails logs are already going to an S3 bucket called “bkt-cloudtrail-logs-sydney”. Clicking the Configure button under CloudWatch Logs section lets you provide the details for a log group:

In this case, we have provided a log group name “CloudTrail-Sydney-LogGroup”. When you click the Continue button, another browser tab will open with the details of an IAM role for CloudTrail to assume:

You can create a custom role from here or choose to use the default one, CloudTrail_CloudWatchLogs_Role, which already has a policy with sufficient privileges. Clicking on the Allow button will close the browser tab and take you back to the CloudTrail configuration window:
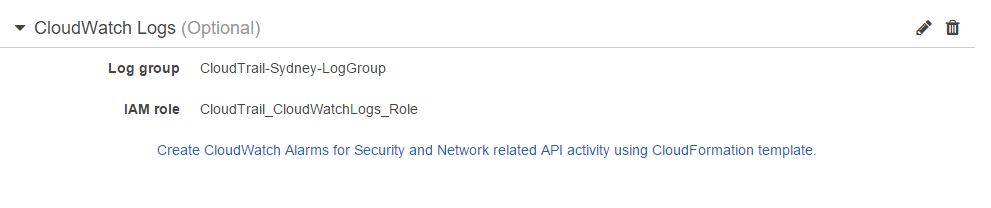
Once set up correctly, the new log group will be available shortly:

And there will be a log stream under it:

As an example, browsing through a CloudTrail log stream shows us an S3 bucket creation event:

Sending Logs from AWS Lambda Functions
The final source of CloudWatch logs we will talk about in this post is AWS Lambda. A Lambda function is a stand-alone piece of code written in Node.js, Java, or Python that runs on the AWS-managed computing platform in response to some event.
When creating Lambda functions, users are freed from provisioning and maintaining the underlying EC2 infrastructure and the load balancing and scaling that goes with it. Behind the scene, AWS dynamically provisions the infrastructure to manage the application traffic.
There are many use cases for Lambda functions. Some of the popular use-cases are provided as templates in AWS Lambda console. In the following image, we have created a very simple Node.js Lambda function based on the Hello-World template. All it does is print a greeting and the current date and time. You can use your own Lambda function for reference purpose here.
Note the console.log statements in the code window. In Node.js, this is the command you use to send information to CloudWatch logs.

Just like EC2 or CloudTrail, Lambda functions also need explicit permissions to write or access AWS CloudWatch logs. It needs to assume an execution role with those privileges at run time. In the image below, we are specifying an IAM role called Lambda_CloudWatch which has those privileges.

The function is also configured to execute every five minutes. However, it’s done here for illustration purposes only:

Refreshing the CloudWatch Logs screen after five minutes will show the newly created CloudWatch log group and log stream. The log stream shows the messages sent from the code. With each execution every five minutes, the log messages add up:


Note that Lambda sends some extra messages to CloudWatch about the actual execution duration and the billing duration. It also shows the memory used during the last execution cycle.
Cloud Academy’s senior software engineer Alex Casalboni had written an excellent post about AWS Lambda and the Serverless Cloud from Amazon Re:Invent. We recommend you also have a look at that post. If you want to dig deeper with AWS Lambda, you can check out our course on the subject: there is a free 7-day trial for our trainings.
Conclusion
We have covered some good ground in this installment of our series. When you combine all the different sources of log data, CloudWatch can quickly become like a central log management server. We could be streaming from a syslog server, firewall, web server or DB server and at the same time logging information from AWS CloudTrail or Lambda.
With time, the accumulated data will grow quite large. Although CloudWatch is perfectly scalable for these situations, we may want to make it easier for us to use and understand. This is what we will cover in the third and final part of the series.
I hope you found some of this article valuable because I learned a great deal writing it. As always, please comment and contribute to the conversation about Centralized Log Management with AWS CloudWatch.