Explore the power of centralized AWS CloudWatch logs
This is the third and final installment of our coverage on AWS CloudWatch Logs. In the first two parts, we saw how different sources of logs can be redirected to CloudWatch. Here, we will see what we can do with those logs once they are centralized.
Configuring Log Retention
Many businesses and government agencies need to keep their application logs available for a specified period of time irrespective of their business value. This is commonly necessary for organizational compliance with government legislation or industry regulations/practices.
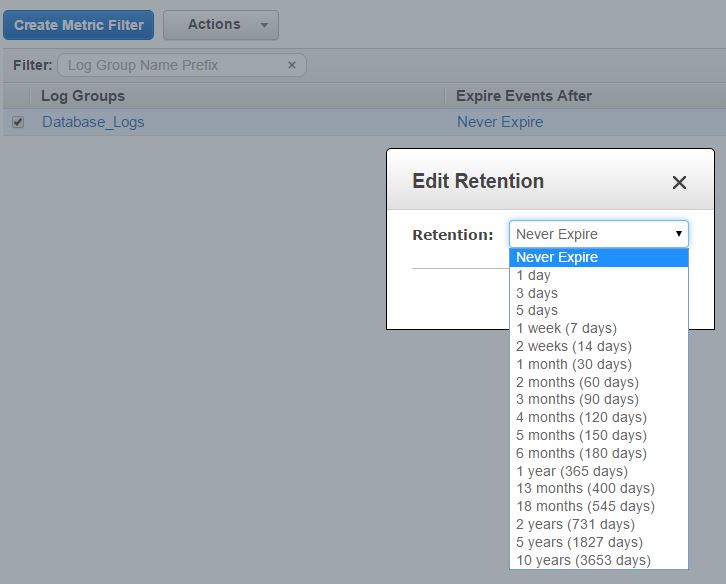
CloudWatch logs can be retained either indefinitely, or for up to ten years, which for most purposes, is a safe retention window. The retention is set at the log group level. This means all log streams under a log group will have the same retention setting.
By default, log groups are created with a “Never Expire” setting. Clicking on the link will open a dialog box where you can set the retention. As you can see below, the granularity starts from 1 day and goes up to ten years:


Once set, any log data older than the retention period will be deleted automatically.
Creating Metric Filters, Alerts, and Dashboards
CloudWatch Logs would not be of much use if they were only a place for capturing and storing data. The real power of log management comes when you find critical clues, visualize trends, or receive proactive alerts from thousands of lines of logged events.
Searching for a particular piece of information from a large log file can be a daunting task. This is especially true for applications that generate logs in JSON or other custom formats. Although there are both free and commercial log management solutions in the market, AWS CloudWatch offers some really comparable benefits in this area. These include:
- Ability to search within a date and time range
- Ability to search through log files with space separated fields or JSON formatted events
- Ability to search through multiple fields within a JSON formatted event
- Simplified search technique with text patterns, comparison, and logical operators
We will start with metric filters and see how they can be used to search within log data. A metric filter is basically a search criterion where the data returned is published in some custom metric.
If you have worked with CloudWatch before, you may remember there are out-of-the-box metrics for services like EC2, EBS or RDS. With metric filters, we can create our own metric for a log group.
In our test case, we decided to search for the text “Error” in our SQL Server log files which are being sent to CloudWatch. For more information on how this was done, refer to the second part of this series. Metric filter search strings are case sensitive, so “error” and “ERROR” would return two different search results. Similarly, the position of the searched string can be anywhere within a logged event. We can’t tell CloudWatch to search at the beginning, middle or end of a line.
To generate errors, we created a SQL Server Agent job that would simulate an error condition every 15 seconds, and log a message.
The following 5 steps show how to create a metric filter.
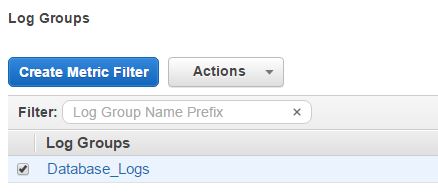
Step 1.Select the SQL Server log group in the CloudWatch Logs console and click the “Create Metric Filter” button:


Step 2. In the next screen:
- Provide the search string (in our case, it was “Error”) in the “Filter Pattern” field
- Select the log stream name from the “Select Log Data to Test” dropdown list. In our case, the log stream name was SQL_Server_Logs”
- Click on the “Assign Metric” button


Step 3. In the following screen:
- Provide a name for the filter (we chose the default name provided)
- Provide a namespace for the metric
- Provide a name for the metric
- Provide a value for the metric value field. In our case, it was 1. With this value, every time there is a match for the searched string (metric filter), the metric will be incremented by 1. The metric will show the running number of occurrences for that particular text.


Once you click on the “Create Filter” button, the metric will be created. This is visible from the log group’s properties:


Clicking on the “1 filter” link will take you to the metric’s page:


From here, clicking on the metric’s name (“SQL_Server_Errors” in our example) takes you to the custom metric’s page. When you select the metric, its graph is shown in the lower half of the screen just like any other CloudWatch metric:


From the graph in this particular image, you can see there have been some instances of the phrase “Error” in the SQL Server logs. You can create an alarm for this metric from the graph. These alerts will send you an e-mail when the number of occurrences exceeds a specified threshold.
You can also create dashboards from metrics you create on your log groups. These dashboards essentially show the same type of graph we just saw. If you think about it, CloudWatch log management now offers a whole new way of systems monitoring where you can have:
- Separate dashboards for each of your application streams (databases, web servers, app servers, middleware and so on)
- Alerts configured for critical errors. Whenever there is an error trapped in the original log file, it will be streamed to CloudWatch and an alert will fire. The alert can then send you a text message or an e-mail.
The following 5 steps show how we created a dashboard for plotting the trend of errors in our SQL Server log.
Step 1. Click on the “Dashboards” link from the CloudWatch console. This will open up an empty page. From here, click on the “Create Dashboard” button, then provide a name for the dashboard.


Step 2. Once the empty dashboard is created, click on its name from the CloudWatch Dashboards console. In the next screen, click on the “Add widget” button with the dashboard selected:


Step 3. A dialog box appears which gives you two options: one to add a metric graph, the other to add a text widget. With the metric graph selected, click on the “Configure” button:


Step 4. From the “Add Graph” screen, choose the namespace from the custom metrics drop-down list. In our case, it was “LogMetrics.”


Step 5. In the next screen, select the metric name from the drop-down list and click on the “Add widget” button. This will create the dashboard as shown below. It can be resized and its time axis can be scaled for different intervals. Once you are happy with how it looks, save the dashboard.


Other Use Cases
It’s also possible to use ClodWatch Logs as a data source for other AWS services like S3, Lambda or Elastisearch. Sometimes you may want to export data to S3 for further analysis with a separate tool, or load data to a Big Data workflow. The export process is fairly simple: just select the log group from the CloudWatch Logs console and select the “Export data to Amazon S3” option from the “Action” menu:
The export process is fairly simple. Select the log group from the CloudWatch Logs console and select the “Export data to Amazon S3” option from the “Action” menu:


You can use the same menu to export logs to AWS Lambda or Elasticsearch. These services can further analyze or process the data or pass it on to other downstream systems. For example, a Lambda function can subscribe to an AWS CloudWatch log group and send its data to a third-party log manager whenever a new record is added.
Conclusion
AWS CloudWatch has come a long way since its inception and CloudWatch Logs will probably only improve in future releases. Despite the obvious benefits to AWS customers, there are some limitations though:
- CloudWatch Logs don’t have rich search functionality and can’t like drill down on one or more searched fields.
- There is no way to correlate events from multiple log streams. Searching an Nginx log stream may show that a web server became unresponsive, at a certain date and time, but the log does not show when this happened because the database server went offline at the same time. A system administrator still has to make manual investigations when troubleshooting a situation like this.
- There is no integration with some key AWS services like RDS, Redshift, or CloudFormation. Logs from these services remain accessible only from their own consoles. Logs from recently added services like AWS Code Commit, or EC2 Container Service are also not sent to CloudWatch.
- It’s time-consuming to create trend analysis graphs from raw log data. You must manually create metric filters on each important phrase or term, and create individual graphs from those metrics.
- There is no way to break down the type of messages in a log stream, and arrange the log entries by different fields such as severity, client IP, or hostname. A pie chart showing such a breakdown would be normal for most commercial solutions.
Many organizations serious about log management will probably build their own syslog server, or use a third-party solution, like Loggly or Splunk. However, it’s still possible to continue using AWS CloudWatch Logs by integrating it with a third-party tool. Most of these solutions already have a CloudWatch connector that can be used to ingest logs from it. For companies or engineering teams still not using a centralized log manager, CloudWatch offers a viable, low-cost alternative.
Cloud Academy offers a hands-on lab Introduction to CloudWatch that may be useful in applying many of the concepts I have covered. Cloud Academy offers a 7-day free trial so that you may explore Courses, Hands-on Labs, Quizzes, and Learning Paths. It is worth checking out regularly as the resources are expanding on a weekly basis. We encourage you to review the previous two posts of this series if you have not already and hope you would gain valuable insight from this multi-part coverage. Your comments and feedback are welcome.


